benchly.nl!
Table of Contents
benchly.nl is an attempt to use publicly available data to help people find interesting places (currently only in the Netherlands).
These places would usually be not so easy to find using GoogleMaps or other similar services. Those are made primarily to make profit for giant tech companies.
In benchly.nl you can find places like:
- Public toilets
- Child-friendly places such as playgrounds
- Picnic tables and benches to enjoy the sunny days
- Street lights to make your walk safer at night
- Art installation and statues
- Bike parking spots
- Bus stops and shelters that could be useful in rainy days
#
Go outside and explore
I enjoy sitting outside on a public bench when I go on a walk with my dog and enjoy the sun and the nature or when in the middle of the city, enjoy the life around me. Very often, these free urban features such as benches or picnic tables are under-utilized and it’s a shame. We are becoming so programmed to go to cafes, bars and restaurants that only cost us money in return for a temporary feeling of luxury. I believe that we should be able to enjoy the nature and the life around us without having to pay for it.
After I started the project I realised, there’s much more than just benches and picnic tables. People with children may be tired of going to the same playground every day. They may want to explore new places and find new playgrounds. If you are in an urgent need of a public toilet, you may not want to walk for 20 minutes to find one (Unfortunately the Netherlands is doing quite bad on this point). For some others there’s is a true joy in having seen every single art installation in the city.
All of these kept me motivated! This is why I started this project and I hope you will find it useful too.
#
Some interesting stats
Disclaimer: Below stats represent the publicly available databases. The actual number of items differs based on how active each municipality is in updating their data. The numbers below are based on the data available at the time of writing this post (March 2025). I hope publishing this analysis will motivate some municipalities to be more active in updating their data. This is not a criticism by any means since there are much more important things the municipalities need to focus on.
While I was making this project, I was very interested in the data and how it can be visualised and interpreted. Below are some of the interesting stats I found.
##
Total number of some urban features
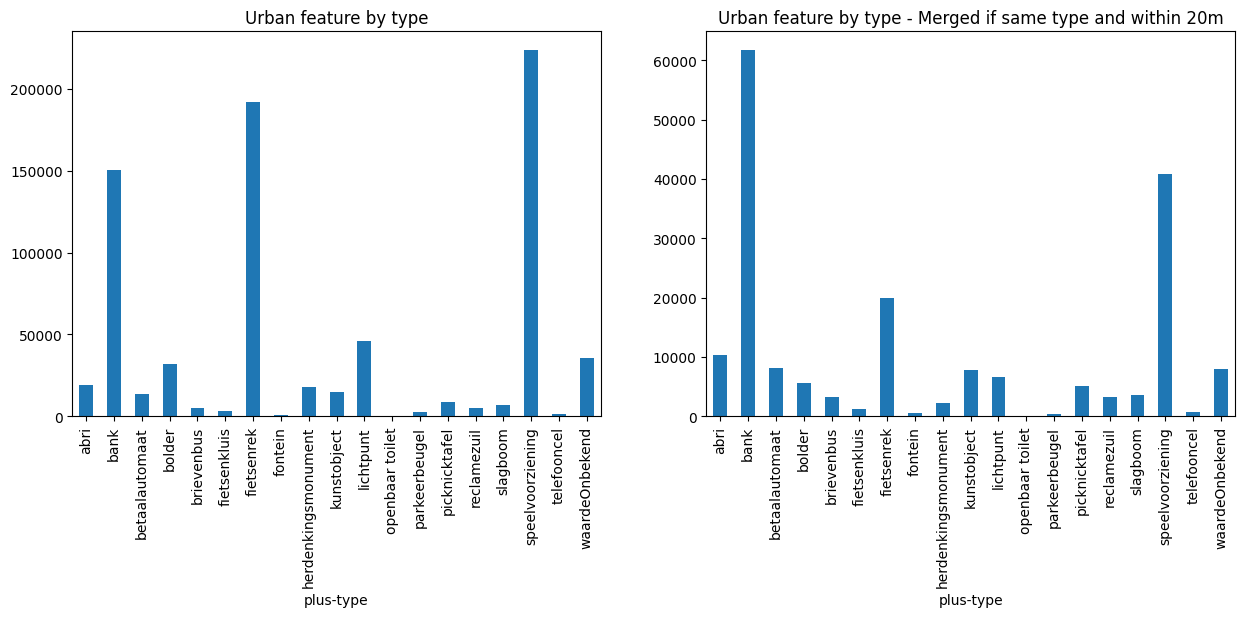
In the figure below, the left side shows the total number of each category of urban features and the right side shows the total number after merging the clusters of the same type within 20m radius to get a more realistic number. For example, if there are 10 bike racks next to each other, they are still one big bike parking spot.
The total number of items in the dataset: 779548

You may interpret the numbers however you like. Some things are to be applauded and for some, there’s still a lot of work to be done.
##
SCAN Index
Just for fun I made up this index to measure which municipality is Safe for Citizens At Night (SCAN). This isn’t a scientific index and should not be used as such. The index is calculated with a very simple (unscientific) formula:
SCAN Index (lights per square kilometers) = (# of Street Lights) / The total area of the municipality (in square kilometers)
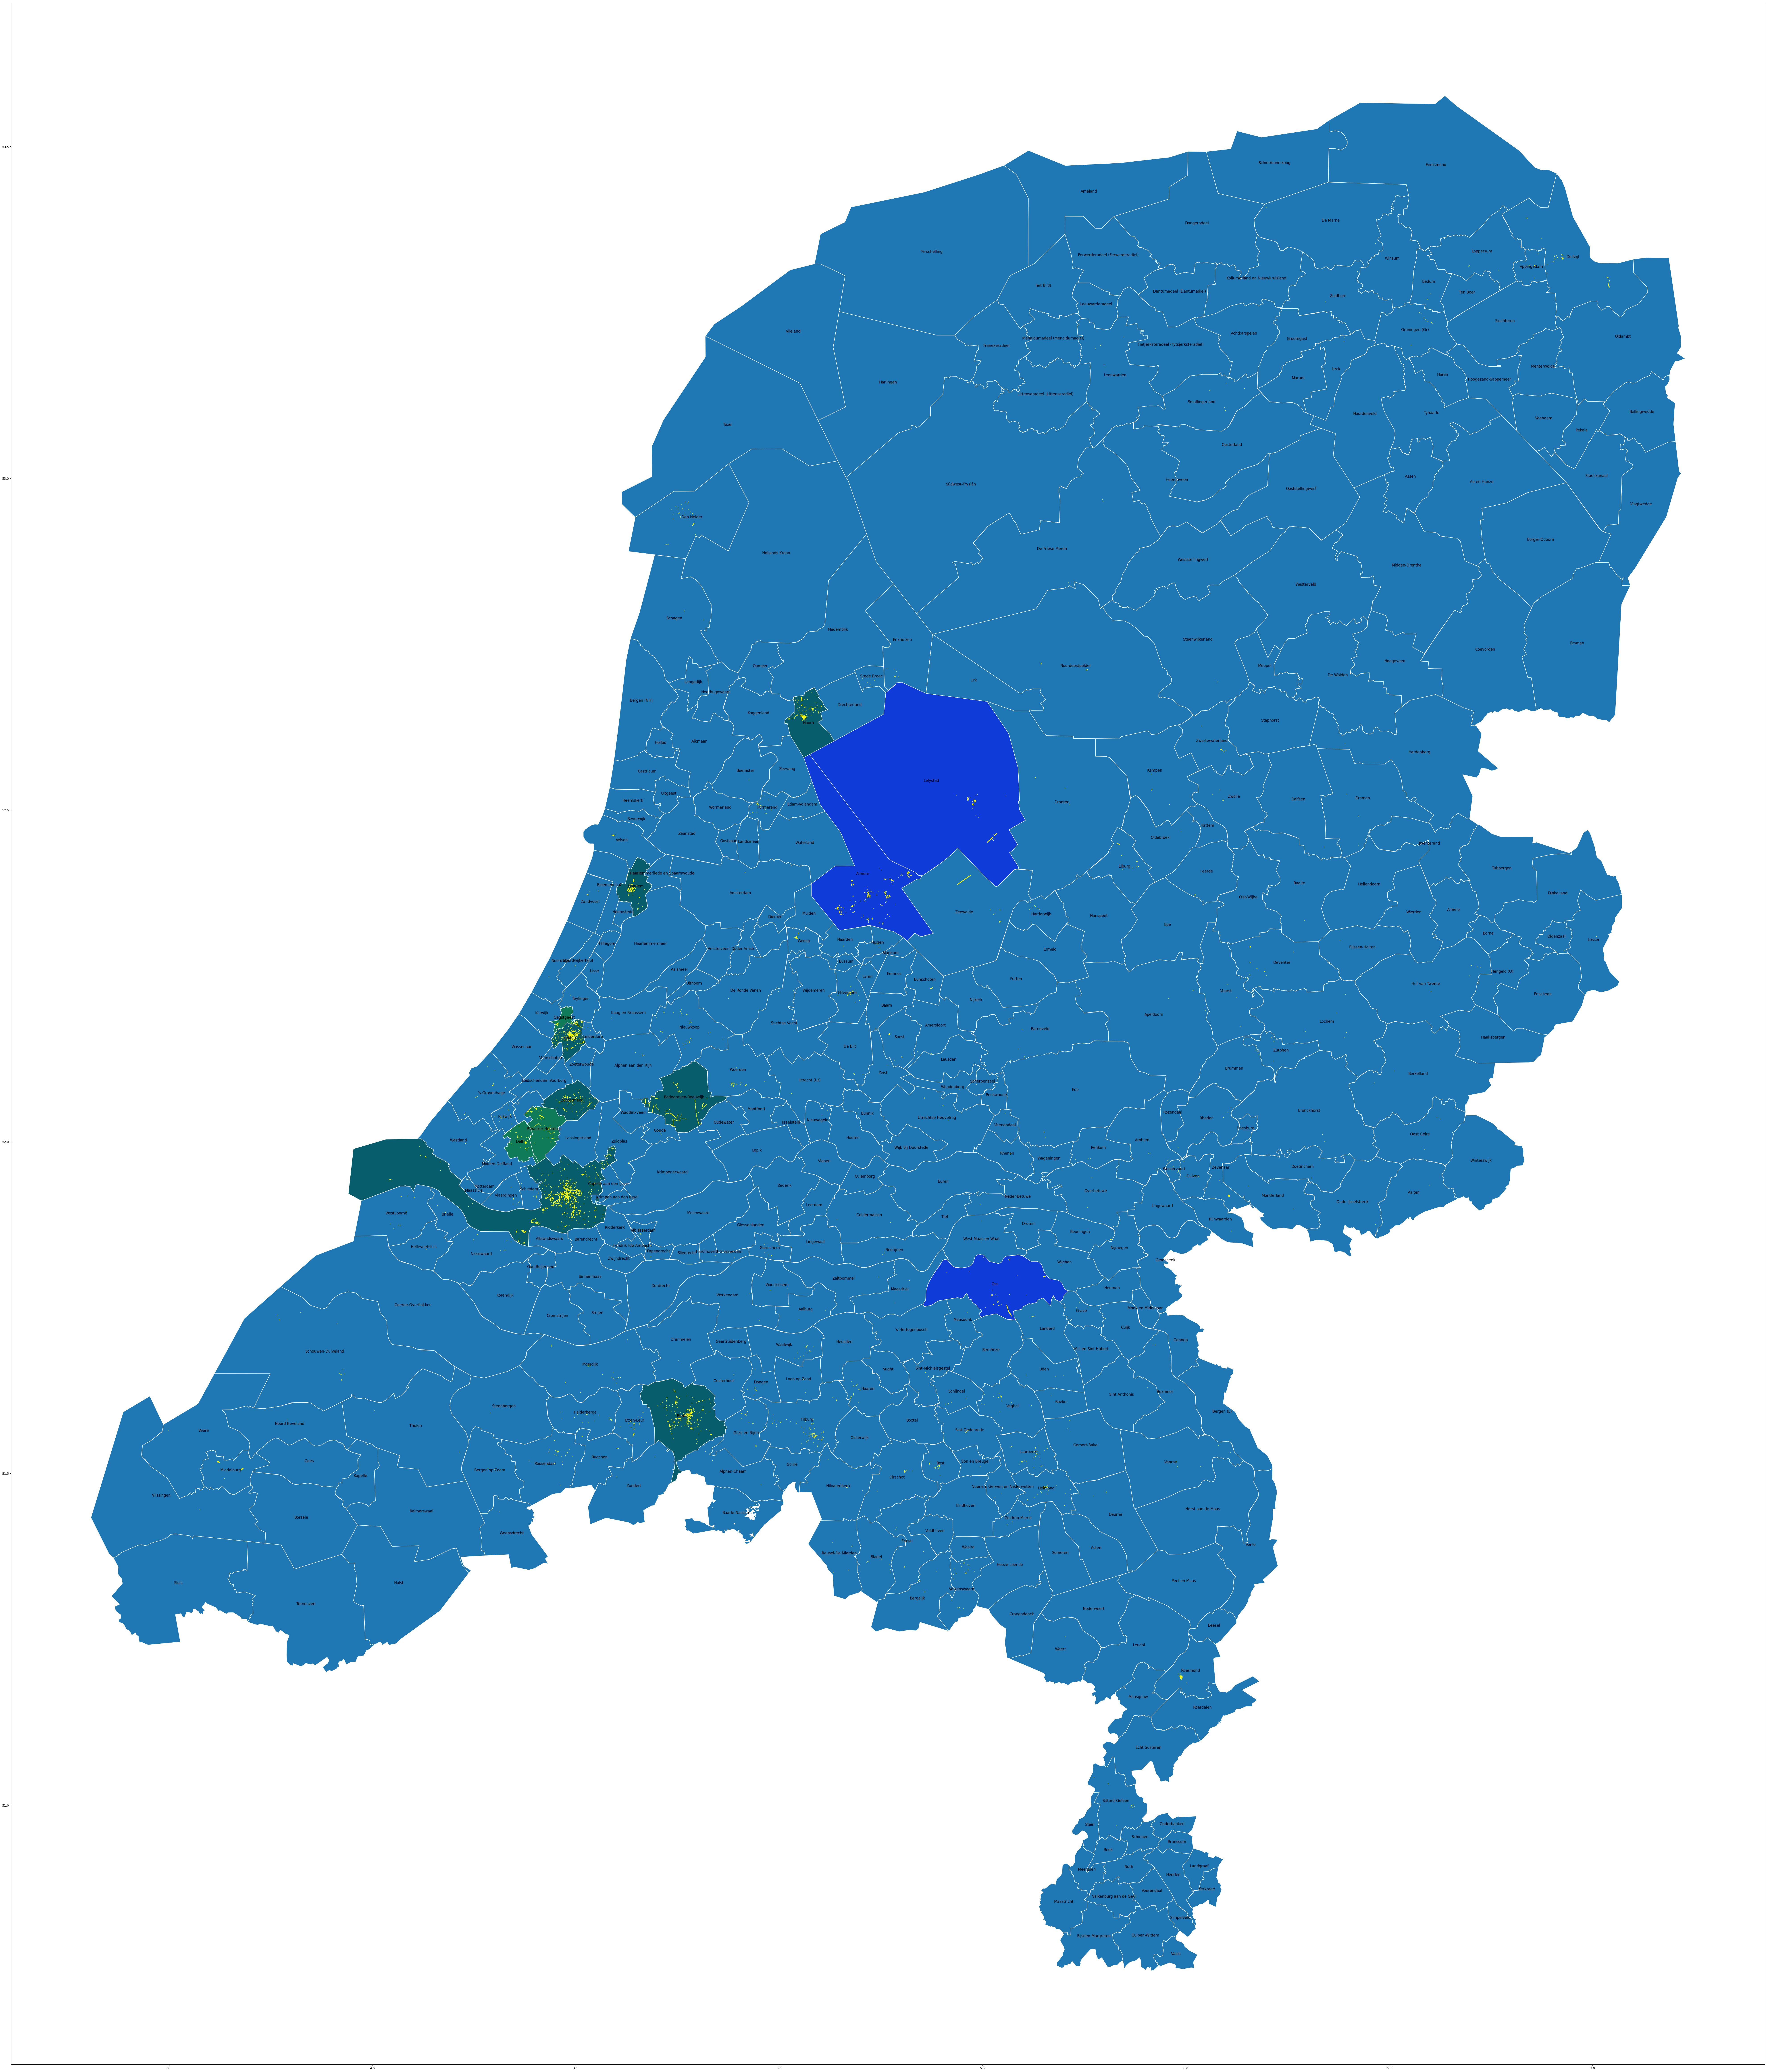
To calculate this ratio, I needed to put all the point data on top of a map of the Netherlands and calculate how many lights are there in each municipality. The result is shown in the figure below.
In total there are 6625 street lights registered in this dataset in all of the Netherlands. So very clearly, this isn’t an accurate number for a real comparison, but this is all the data we have, so let’s have some fun with it!
Let’s start simple. Below is the list of the top 10 municipalities with the most street lights:
| Rank | Municipality | # Registered Street Lights | Area (square kilometers)* |
|---|---|---|---|
| 1 | Rotterdam | 1699 | 324.364 |
| 2 | Breda | 563 | 128.72 |
| 3 | Leiden | 560 | 23.2329 |
| 4 | Almere | 370 | 248.304 |
| 5 | Bodegraven-Reeuwijk | 327 | 88.3628 |
| 6 | Hoorn | 241 | 53.3428 |
| 7 | Haarlem | 212 | 32.1748 |
| 8 | Zoetermeer | 189 | 37.014 |
| 9 | Lelystad | 162 | 765.956 |
| 10 | Oss | 155 | 159.665 |
What I love about this list is that I saw the name municipality “Bodegraven-Reeuwijk” for the first time ever and immediately got curious about it!
Notes about the area:
- The area is an approximation and isn’t the exact area of the municipality
- In some cases, the name of the municipality is the same as the name of the city, so don’t be confused by that. For example, Leiden is a city and a municipality for the exact same area, but Breda is a city inside a larger municipality which is also called Breda.
And now let’s see the top 10 municipalities with the most street lights per total municipality area, which I call the SCAN index:
| Rank | Municipality | Density of Registered Street Lights per total area | Area (square kilometers) |
|---|---|---|---|
| 1 | Leiden | 24.1037 | 23.2329 |
| 2 | Haarlem | 6.58901 | 32.1748 |
| 3 | Rotterdam | 5.23794 | 324.364 |
| 4 | Zoetermeer | 5.10618 | 37.014 |
| 5 | Hoorn | 4.51795 | 53.3428 |
| 6 | Breda | 4.37385 | 128.72 |
| 7 | Oegstgeest | 3.9537 | 7.84076 |
| 8 | Bodegraven-Reeuwijk | 3.70065 | 88.3628 |
| 9 | Pijnacker-Nootdorp | 3.64796 | 38.6518 |
| 10 | Delft | 2.19702 | 24.1235 |
As you can see, Leiden is the absolute winner of this index. It is a small city with a lot of registered street lights. This is a good thing for the safety of the city and its citizens.
Below is a map of the SCAN index.
- Dark blue: top 10 municipalities with the most number of street lights
- Light Green: top 10 municipalities with the most density of street lights per area
- Dark green: municipaties in both of the above lists

Are you interested in more stats? Let me know and I will add them here.
#
Served from my home
This project is served on my homelab. This was a lot of fun to create. I may expand this section in the future to include more technical details, but for now I would like to keep the focus on the project itself.
#
Final words
Looking forward, I hope with this project I can help people find more joy in free urban features out there and go discover them.
Regarding the data analysis, I could repeat the same analysis for other urban features but the point here is, publicly available data is very valuable and can be used to help citizens in their daily lives. Since the available data isn’t close to the actual state of the cities, it’s not possible to draw any conclusions, so please be careful with how you interpret the data and make assumptions.