Building a Cost-Optimized Real-Time Event Streaming & Analytics Platform on Kubernetes
Table of Contents
Recently I’ve taken on a challenge to set up a real-time event streaming platform that allows our developers to build complex event-based systems without having to worry about the infra, costs, growing complexity, and security. In this article I’ll talk about my learnings along the way. The goal is to touch on all the concepts and gotchas you need to be aware of and draw an example big picture. I will explore many aspects of the system and explain all the tricks I learned and failures I had along the way. I won’t be going too deep in every single topic, nor will attempt to give you a line-by-line implementation tutorial as that could take me a lifetime. I will update the contents based on any feedback I may receive or if I learn something new to keep it educative. For most component-specific topics, I highly suggest reading the official documentation as anything I put here will soon get outdated.
#
A bit of intro: The not so technical part
The Teams within our Area (department) at DPG Media offer solutions that allow serving videos and podcasts, playing games, on a large range of our brands. To make it more clear, for any videos you see on ad.nl, any podcasts you can listen to on hln.be, and any puzzles you can solve on volkskrant.nl there are a few requests that go through our services. We’re responsible building the web players and serving the content metadata, but the storage and streaming of the media content is currently done by other areas within DPG. As one of the largest media companies in both the Netherlands and Belgium, we serve content to millions of users per day.
As SecDevOps/Platform Engineers (Or whatever you want to call it), together with my 2 other colleagues, our role is to build a reliable, and secure Platform for our development teams that allows them to focus most of their energy on building features!
##
Our current stack
Our Platform is built for most part on our multi-cluster Kubernetes instances, running on AWS EKS nodes that we manage ourselves using Karpenter. All of our applications and platform components are deployed using Kubernetes and we only use a small set of AWS resources where it would otherwise not make sense to use self-hosted solutions. In general we prefer self-hosting as much as possible where the company policies allow and not use AWS native or managed services.
##
Why did we need a Streaming & Analytics Platform
Our developers are constantly building new features and experimenting with different ideas. Sooner or later every application needs to send some events. To give you some examples, for every game our users play, some streaks calculations need to be done, for our podcast solutions, we need to store the listening progress of our users so that they can continue where they left. For our videos, we need to be able to get visibility into what are the most replayed sections. Some of our smaller scale solutions were doing their own form of event streaming but the effort was scattered, and the solution was too expensive and not scalable. In some cases, the database was being abused as a ledger so that the events could be replayed and the state could be recalculated. In the absence of a proper solution, you should expect the application developers to become very creative!
To enable our devs to build such features quickly without getting bogged down into never-ending database growth hellish situations, we needed to offer a solution with the following characteristics:
- It must be easy to use: If the learning curve for the developers is too steep, they will either need special training or will rely on some AI and make so many mistakes that will counter the whole point of this task. This should allow our developers to not only send events around but also do complex transformations, state storage, enriching and aggregating data as they flow without large latencies.
- It must be resource and cost-optimized: Our scale is larger than what smaller companies may be used to, but it is by no means near a number in which you would feel a real challenge. Hence, spending too much money to be able to process such small amount of events would not be a good example of engineering. Modern computer hardwares are insanely capable and we should build better software solutions that do not waste all of that advancement effort, energy and money.
- It must be stable and scalable: Event streaming at scale is HARD and if you don’t get it right, you can really shoot yourself in the foot, wasting months of effort and having to rebuild things. This solution will be used as a single foundation for many of our applications. This also means that if it does not perform well, it will turn into a single point of failure.
##
Our first tenant and expected load
To build this and test it out, we needed a safe tenant to experiment with. Hence we started with a new telemetry service for our videos. A new addition to our largest component where the amount of data is the highest but the possible damages are the lowest.
When designing such solution, one of the most important questions is: how much load should it be able to handle?
For us, the calculation was slightly vague because prior to that we could not measure every user engagement that we would have liked to. We started with the load on our largest component (serving video content) which has been around a total of 6-10k requests, and if we drop the cached requests, it goes down to 2-3k rps.
So we started by designing our event payload and counting how many events a user would be producing per page load and as they keep watching videos. With a few calculations we got to a rough estimation of 30k rps. Our average payload size is about 100 bytes. Let’s multiply that by 10 and say our events are 1kb each. 30,000 rps * 1000 bytes ~= 30MB/s throughput. 30MB/s is not a huge number, so we should be able to easily build something that can support this. In future we are certainly going to go way beyond that number, especially where we have to support existing json-formatted events, so we should be thinking about a much larger storage, but to keep things simple, let’s consider this for our POC.
##
What does “Real-Time” mean
We would like our end-to-end latency to be in the range of milliseconds. For all of our use cases now and in near future, we can tolerate a worst-case processing delay of a few seconds. Weather our system performs in the optimal 2 digit milliseconds range or is having a bad time and take a few seconds to process events, we need to build resiliency in it in such a way that temporary malfunctioning of a component doesn’t result in data loss or corruption and that once that the rest of our applications can remain functional.
If you really want to be terminologically correct, then this is a near-realtime solution. However, to our users, this feels almost instant.
#
The choices: so many choices
A real-time event streaming platform that is able to support both transactional and analytical purposes consists of many components. Choosing each, carefully will save you many sleepless nights.
##
The Event-Store: The heart of the system
This is arguably the biggest choice in this whole set up. Within our company, Kafka is the only allowed choice! It has a proven record and we have more people within the company who have hands-on experience with. So this made everything a lot simpler. Now all I had to do was to figure out what is the best way we can get our own instance of Kafka hosted somehow.
The bullet points below are the first comparison summary I wrote down in an internal document (Please don’t get offended if you work in one of these companies):
- Strimzi with vanilla Kafka: Great but needs disks and cross-AZ network traffic which makes it expensive.
- AWS MSK: Okayish at the highest price we can get.
- RedPanda: Good performance that we don’t need at not so much gain in storage and network costs.
- Confluent: Great but at a cost and needs licensing (bureaucracy).
- WarpStream: Great but not self-hostable. Needs licensing (bureaucracy). Diskless Kafka.
- AutoMQ: Amazing stuff at a reasonable trade-off. Diskless with the possibility of adding EBS for local WALs.
- Aiven: Too young and cloud-only. Diskless.
In this article I will not go too deep into the comparison of these solutions. There is enough comparison material available out there and many of these solutions offer a calculator for their pricing. Instead I will tell you what we ended up choosing and how we put it all together.
In terms of scalability, all of these solution can scale way further than we would need in the coming years.
###
Maintenance overhead of self-hosting vs a managed solution
Setting up a Kafka cluster is simple. Keeping it alive and up to date is not. With our current capacity of our Platform team, we needed to be careful with how much overhead we add to our daily lives. Gladly, Strimzi really minimises the amount of effort needed for maintenance. You would still need to learn how Strimzi and Kafka work in some depth but operating Kafka with Strimzi is orders of magnitude simpler than having to do all the clustering manually yourself.
Using a managed service, we of course no longer have to deal with any of the pain, but at a cost. [And honestly what is the fun in life if we use everything managed? What is so bad about taking up a challenge, show courage and fail responsibly?!]
###
Cost
Once you start digging in features and costs of each of these solutions, you will soon realise that the cost is a huge factor. Some of these solutions are substantially cheaper than others at a very reasonable trade-off. Since our Platform runs on Kubernetes
Let’s consider our POC scenario:
Throughput: 30,000 events/sec * 1 KB = 30 MB/s
Ingress: 30 MB/s * 3600 * 24 * 30 ≈ 77 TB/month
Replication Volume: 77 TB * 2 (followers) = 154 TB/month cross-AZ
Storage: 7 days retention ≈ 18 TB logical storage
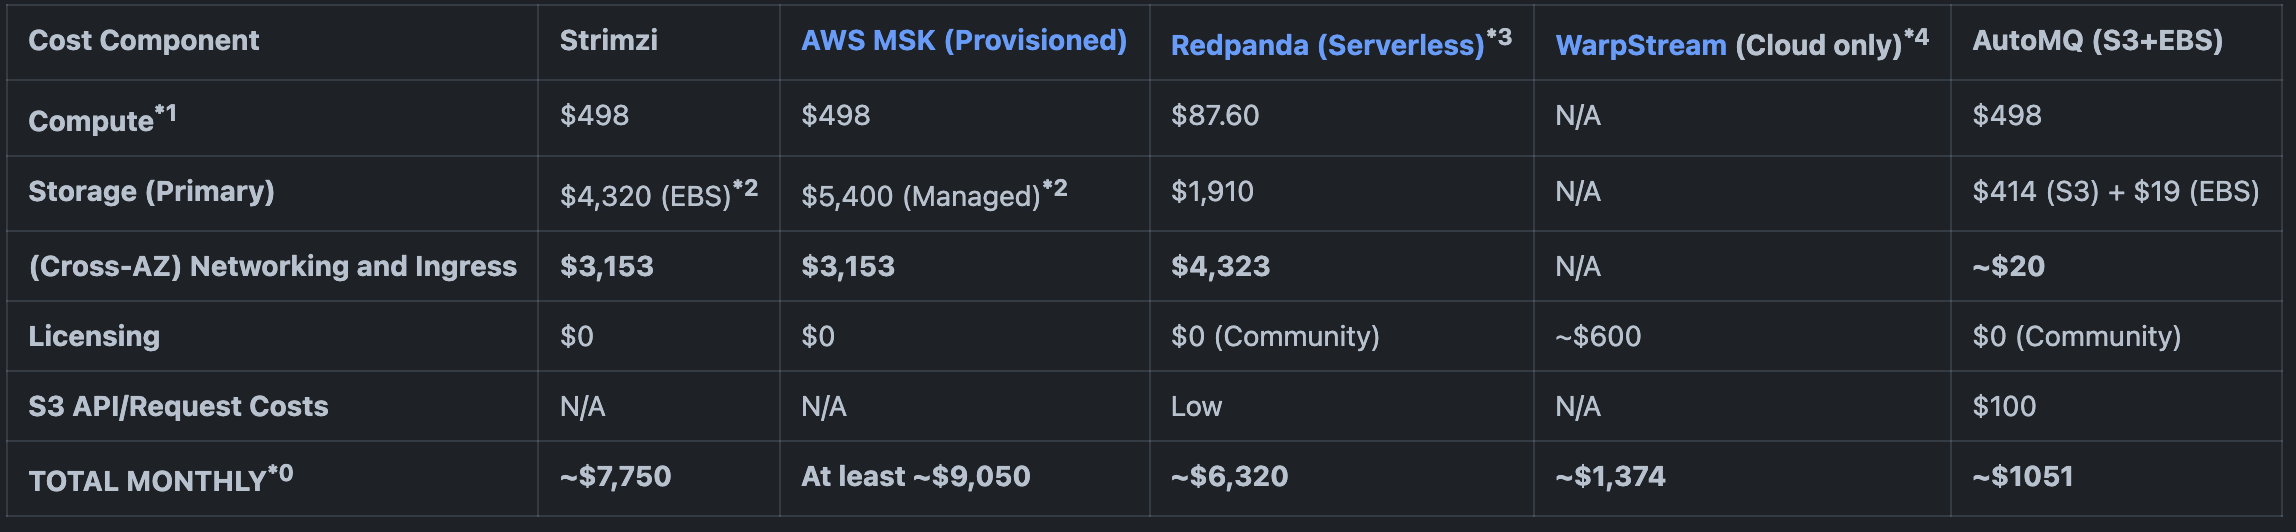
Notes on the above image:
- Calculating the costs are not very straightforward so the values may not be exact but the proportion is valid.
*1: For compute costs, anm7g.largeEC2 instance is used*2: Both Strimzi and AWS MSK options support KIP-405: Kafka Tiered Storage so the storage cost could be lowered but I can’t easily calculate how much lower.*3: Redpanda also has a Kubernetes operator like Strimzi and can be self-hosted, however, Redpanda isn’t going to be happy with GP3 EBS disks and would require locally attached NVMe disks (For examplec5dorc5adEC2 instances)*4: Warpstream doesn’t have a self-hostable solution. On top of that, due to how it is architected, it adds a high latency to the events (depending on the pricing tier and the percentile, anywhere between 100 to 900ms). See more on their pricing page
Honorary mention: Confluent cloud being the de-facto solution out there for many large enterprises isn’t very clear about their pricing. This is an example they give in a sub section somewhere random in their pricing page:
The total throughput per month determines the $/GB applied to all Kafka throughput in that month. For example, if the total Kafka throughput for a given month is 300TB (307,200GB) for a Freight cluster, the price applied would be $0.025/GB for a total of $7,680.
But they say we can save %43 compared to baseline Apache Kafka (so in our case compared to Strimzi)
Bottom line of this section is that we do need a solution but our requirements are not at a scale that can justify a massive bill. We want the solution to be cheap at the start but it must be able to scale as our needs grow. We do not want to do too much premature optimizations (just a little bit).
###
Now what is KIP-405 (Zei er iemand kip?)
If you’ve been reading about Kafka recently, you may have heard about their Tiered Storage. This makes Kafka feel a lot more modern. Now you might ask yourself why would someone consider AutoMQ when Kafka already supports offloading old data to S3. The answer is that AutoMQ is architecturally still different than the KIP-405 design in that they do not use EBS volumes as a primary storage but only as a WAL storage. With KIP-405, the active (hot) data remains on the EBS volumes and older (cold) data is put in S3. That reduces costs compared to the “traditional” Kafka architecture but doesn’t completely get rid of the Cross-AZ communication and doesn’t make the pods stateless. AutoMQ is completely stateless. This page on AutoMQ docs explains this architectural differences nicely.
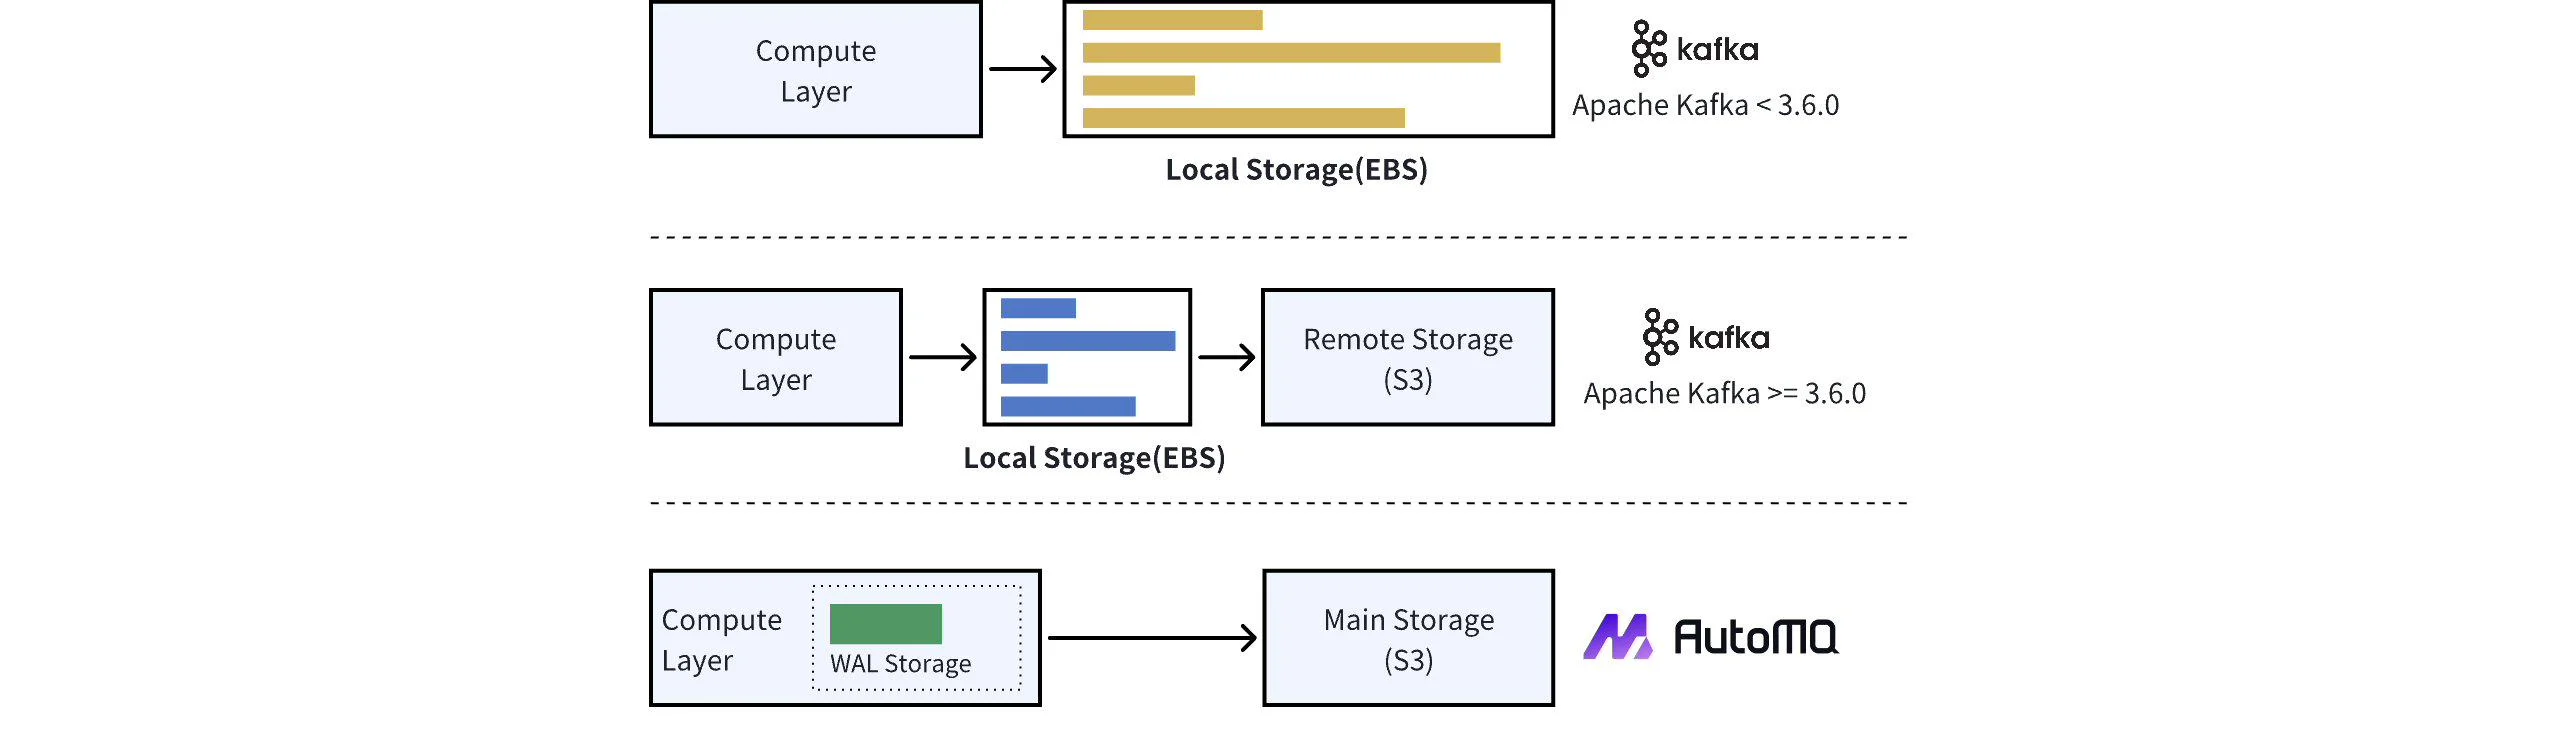 Source: Difference with Tiered Storage - AutoMQ Documentation
###
What if we use Strimzi, but with AutoMQ instead of vanilla Kafka?
Since there was no way I could convince my manager that we should pay $6k+ per month on this (Our entire production AWS bill is less than that btw), our options were limited.
One thing I learned along the way was that we can use Strimzi with AutoMQ images! This was a major finding for me because it meant that we could use the operator and pay the lowest possible cost. Our EBS disks would be 20GB max and we skip the majority of Cross-AZ Network communication.
AutoMQ’s GitHub page describes them as:
Diskless Kafka® on S3. 10x Cost-Effective. No Cross-AZ Traffic Cost. Autoscale in seconds. Single-digit ms latency. Multi-AZ Availability.
As you may have noticed, with AutoMQ’s architecture, fetching cold data requires calling S3 which could add a few milliseconds to the initial requests but for us, that slightly added latency is not an issue for the forseeable future. The majority of our applications will only be consuming fresh events and will not need replaying a large chunk of historical events, minimizing the GET calls to S3. If they do need the cold data, then they are also in all cases able to tolerate the slight delay.
So this was the choice that we made: Strimzi cluster using AutoMQ Kafka images.
##
The Event Stream Processor: The Kidney of the system?
Once you have events flowing in, you will want to transform them, enrich them, aggregate them, etc. and once you are done with your processing you want to store the checkpoint/state somewhere you can query later.
Note: This is a component that you may not need if you prefer to have all of the processing done by your application and you already have a way to store checkpoints of your data. In fact, if you’re too new to this, it might actually be easier for you to start with the technology stack you’re comfortable with and at the start, just focus on learning how to deal with Kafka and event streams. As you learn your system better and understand the bottlenecks, you can switch to a more advanced solution.
For this component you again have many options. The major competitors are Apache Flink, ksqlDB, Kafka Streams, and The usual suspects (Confluent Platform, AWS Managed services). These are all however a bit icky. If you ever tried to write a simple processor in Apache Flink, you will know that there’s no way you’re going to get past the beginner stage unless you dedicate years of your life to it and really study Flink in depth. I can’t force our developers to that path.
Remember our requirement:
It must be easy to use
And let’s say you did use Flink. You’d still need a DB to store your state in it if you are to query it.
While a solution like Apache Flink is probably the most powerful and flexible thing you can get out there, we don’t need most of that. We need a simple way to chunk through a few hundred thousand events per second with high efficiency and achieve near real-time (<2s) queries to it.
This is where I started becoming very interested in ClickHouseDB. ClickHouseDB is a columnar LSM-Tree (They say: “based on traditional log-structured merge (LSM) trees with novel techniques”) OLAP database. It has a direct integration with Kafka and offers more than enough real-time event processing features than we would need for the forseeable future. It scales nicely, supports replicated tables, easy partitioning, TTL setting per table, allows for event enrichment using Dictionaries, has incremental materialized views that simplify aggregations, support for Protobuf messages coming from a Kafka topic, and I could keep going. It is genuinely a piece of software to get excited about. And if all of that was not enough, recently they started offering clickhouse-operator for Kubernetes.
After giving it a test run and setting up a local instance to play with, I really enjoyed writing queries in it. ClickHouse’s Incremental Materialized views are very different than Postgres’s Materialized views, if you’re familiar with those. The naming might be confusing a little at the start and there’s a slight bit of mindset change when you start using ClickHouse MVs but when you get used to them, you suddenly realize what a powerful event transformation pipeline you have in your hands. The video on this page explains them very nicely.
ClickHouseDb matched all of the criteria I was looking for, it is simple, it is very powerful, and since we can self-host them in our Kubernetes clusters and have full control over the compute, we can host them at a very low price. So there’s that.
##
Event schemas: Blood type? (This is getting out of hand)
Kafka is data-agnostic, so as an event-producer you could send an arbitrary byte array as the event message and Kafka couldn’t care less. The only thing that matters is that your producers and consumers understand the messages moving through the system. So early on in your event sourcing and streaming journey you have to decide on an event schema type.
###
Choose either Avro or Protobuf
With Kafka, your top options are Avro, Protobuf, and if you are lazy, have too much money, and only have experience writing web apps, JSON. If you’re very hardcore, you could also define your own custom binary format if you are certain that your schema won’t change, but I wouldn’t go that way. Your schema will change 2 hours after your first release because “you forgot to count for that thing there”. Initially I really wanted to try Avro because the Kafka ecosystem has a good support for it and it removes the headache of code generation. However, we quickly realised that there are a few issues that I wasn’t very comfortable with:
- Client library support for it for our Swift client apps weren’t great.
- I wasn’t really sure about having to attach the schema to messages and how much overhead that would add.
- Lack of field tags in Avro and it’s positional layout means that you could accidentally get schema mismatches and introduce silent failures. Since our schema changes quickly, this wasn’t a risk I was ready to take and I was quite sure that this would be a mistake we would make multiple times. Whether this is seen as an advantage or disadvantage really depends on the scale, rate of changes, and the organization topology you work with. Here’s a good in depth comparison (Also included in the DDIA Book).
So then I started leaning towards and old friend. I had prior experience with Protobuf when using GRPC based transport and was generally positive about it in the past, except the tooling and code generation headaches. Luckily these days Buf exists. Buf simplifies the code generation and let’s you choose between their free remote plugin or locally installed protobuf plugins to generate code. You don’t necessarily need Buf, but it does removes some pain, especially regarding managing protobuf generator versions and keeping them up to date.
The reason the title of this section is opinionated is that when you’re getting so much data in, you should be ready to get out of your comfort zone of “JSON is human readable”. Projects like Protobuf and Avro rely on clever techniques to reduce the total data size that needs to be transmitted, computed and stored. See Protobuf’s varint documentation for example which is aiming to minimise the space needed to send an int over the wire. JSON, however, is meant to be easy to be read and modified by humans. So they’re built for totally different purposes. If you get 5 requests per seconds on an endpoint, you probably shouldn’t over-optimize and use binary formats. But at a higher scale, optimizing for storage and network costs is cruicial. By choosing a more compressed data format, you are reducing costs drastically. If you have your event payload at the hand, you can use a tool like protobufpal or to write a simple script to calculate the difference between a JSON message vs Protobuf. If your event contains many fields and some have long names, you are pretty much guaranteed to get 50%+ reduction rate. For us that is really the case. Our average JSON message payload (without tabs and spaces) was about ~290 bytes whereas the Protobuf message was only about 100 bytes. That is almost 3x savings in both Storage and network cost. Also in terms of serializing and deserializing performance (compute resources needed), Protobuf and Avro are superior, very largely due to them not having to scan through a schemaless string. You could argue that we could win some by using very small fields names like pl instead of platform or t instead of timestamp_ms, but then you’re defeating a big purpose of JSON: readability.
####
Schema evolution
I don’t think I need to go into depth with this one. There are countless articles including the one I referenced earlier that explain this way better I could.
The goal is, you must be able to introduce changes and be able to revert those changes with minimal damage. Protobuf, Avro, and JSON are all nicely evolvable. There are details regarding the differences between Avro and Protobuf which makes the choice very use case dependant.
####
ClickHouse’s Protobuf support
ClickHouse has support for all the 3 aforementioned schema types.
My experience with it’s Protobuf parser together with Kafka Table Engine was mostly positive but I sometimes had to look a bit further than just the documentaion. I’ll explain how you can set it up in a further section.
###
Schema registry and ClickHouse
ClickHouse doesn’t work nicely with Confluent Schema Registry out of the box. The reason being that schema registry prepends 5 bytes (1 Magic byte + 4 bytes schema ID) to the message on the producer side and expects those 5 bytes on the consumer side to be able to parse the message. If you are planning to use schema registry, you would either need to put KafkaConnect or similar in-between your broker and ClickHouse or use ClickPipes. You could also skip schema-registry and move the parsing logic to your producer and consumer side. This is a simpler approach if you only have a single schema per topic. You could also selectively use schema registry where needed and not use it in cases like this. There’s no one forcing you either way.
Note: Kafka Table Engine has a kafka_schema_registry_skip_bytes setting which helps you configure it to at least ignore the 5 bytes header and move on but you still need to rely on manually providing the schema for the table.
###
Code generation for .proto files
.proto files
We have all of our Protobuf schemas in a single repo. That allows us to have a unified CI pipeline that generates libraries for all of our client applications, ie: Java/Kotlin, Swift, TypeScript, Elixir, Golang. When we modify a certain schema file, we trigger the code generation and package the generated code to our package registries. The packages are then added as a dependency to our applications. Applications use the definitions in these packages together with a protobuf library to turn their model instances into protobuf formatted binary and use an HTTP library to send that to our gateway.
##
The gateway: The mouth?
Unlike your mouth, this component is optional and whether you need it depends completely on your specific setup.
As long as you have your data within your private network and Kubernetes cluster, you could talk to the Kafka broker directly with some level of authentication and there would be no need for a middleman. However, when your event producing clients reside outside your K8s cluster (in our case, our mobile apps and websites), you need a secure gateway to let clients send data to. You may also not be able to introduce a completely new protocol in the clients. We operate in a large organization that consists of many application and web development teams that have complex rules on the libraries and dependencies they use and one team cannot simply add a new library to the stack without a large amount of coordination. For this reason, we really needed to rely on the good old HTTP protocol for sending telemetry data. This wasn’t a major issue. We can write whatever binary data comes out of our protobuf library into a POST payload and have a server forward it to our Kafka cluster.
For this purpose you could use an existing solution such as Confluent’s Kafka Proxy or Strimzi’s Kafka Bridge. I however have strong opinions on some matters and like to make my life harder by creating things in certain ways that serve one purpose and do it in the way I can. So I created a simple service in Golang with the standard net/http package and made sure that there will be no runtime memory allocations (at least by my code. I can’t control what net/http does.) on the hot path by using a sync.Pool for the byte buffers. It does exactly what we need and does not waste any compute than strictly necessary. The core code is less than 200 loc including whitespaces and contains another 200 lines of metrics and observabilty generating code. In practice it handles 20k rps with 2 pods each using 40-50Mi RAM usage and about 300m CPU each. While I also love Rust, it would’ve been a bit overkill for this.
###
Authentication limitations for anonymised data
There has some big limitations when collecting data anonymously from web and mobile clients. While there are some native attestation APIs for mobile clients and you could do some level of CAPTCHA or trust tokens on web, there’s no simple bulletproof way of telling a bad actor from a normal user. One way to get around this is to create dump ingestors that only validate a certain number of things such as payload size and the schema and just pass it to Kafka. You would then need to do a round of validation afterwards which is less than optimal, but it makes your system more resistant towards DDoS attacks.
On top of that you can also separate your ingress for the high-throughput anonymous telemetry data from the very important events and have less strict rules for the anonymous ones and heavy rate-limitting and authentication for your vital events. This guarantees that you will never miss important events and that you have a strong authentication for those while your less important data can be ingested with less pain.
#
Putting it all together
Great! Now we have a full picture of what we want to build. Let’s continue building our POC of a Telemetry Dashboard for our Video content.
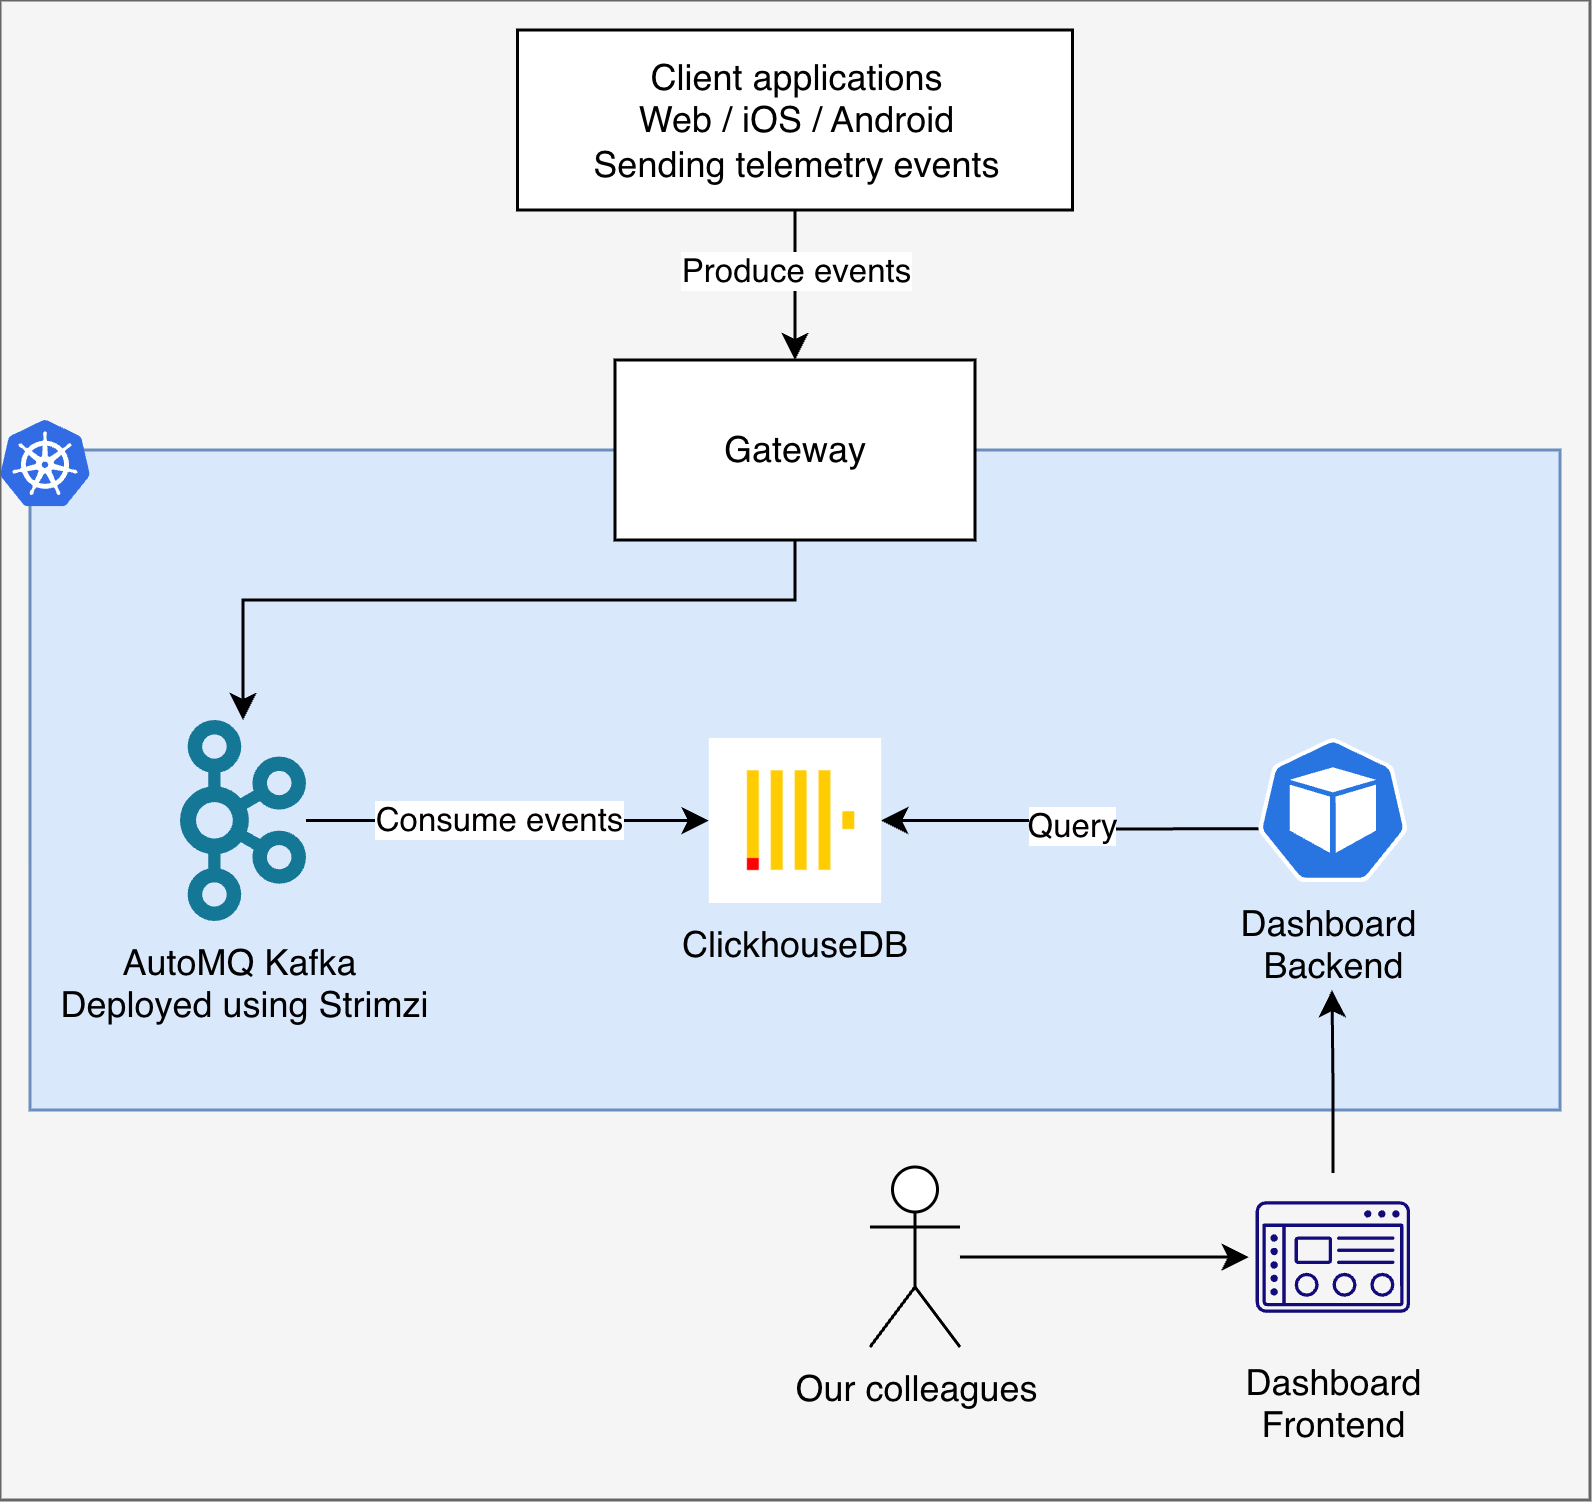
Note that I’ve stripped every bit of details from this, for example: The VPC and Networks involved, S3 Buckets and EBS Volumes (via Kubernetes PVCs and SC) attached to Kafka and Clickhouse, Authentication, Network policies etc. This is just to give you a general idea.
From this point your task would be to:
- Set up the Strimzi operator.
- Set up a chart that let’s you create a new instance of a Kafka cluster and all it needs to be usable by other applications.
- Set up the gateway.
- Set up code generation.
- Set up the Clickhouse operator.
- Set up a chart that let’s you create a new instance of ClickhouseDB and all it needs to be usable by other applications.
- Test the flow.
- Improve!
For the most part, you would be better off reading the official installation and usage documentation. In the next sections, I’ll be explaining the harder bits that you won’t immediately notice.
##
Strimzi and AutoMQ: The crux
###
Don’t vibe this part. Learn the theory and test your learnings in practice
This is the part that took me the longest to fully understand, implement, and test. I’ll be honest with you; There’s no way to fast-forward this step and you must absolutely understand a bunch of concepts before you can consider this a job well done. You may be able to speed up the learning process by using LLMs to explain things to you but I absolutely discourage you against letting an AI take the control of this implementation while you “Yes” your way to a grand failure. Kafka is a complex distributed system and should be treated as such. Strimzi helps to simplify the set up, but it does not remove the need to understand the underlying system.
###
Strimzi operator and AutoMQ version compatibility
Before you start with this setup, you must be aware that you’re now dealing 3 software versions:
- Strimzi Operator version
- AutoMQ version
- (And each AutoMQ Version is compatible with a specific) Kafka version
So it is essential that you first find the exact version of each component that matches the rest.
I would start here. On that page you can see which Strimzi Operator version is compatible with which Kafka version. Then go to AutoMQ’s releases page. There you can find a file in format automq-{AUTOMQ_VERSION}_kafka-{KAFKA_VERSION}.tgz. At the time of writing this article, the latest AutoMQ-supported Kafka version is 3.9.1, so the latest Strimzi version I could use is 0.47.0 (which is compatible with Kafka versions 3.9.0, 3.9.1, 4.0.0).
This is something you need to take into account when upgrading any of the components in the chain. You will risk possible data corruption/loss if you deploy mismatching versions, so I highly encourage you setting up an acceptance environment which you can evaluate any changes before pushing those changes to prod.
As an example, here’s how you could pass versions to the strimzi-kafka-operator Helm chart at the time of writing this article:
strimzi-kafka-operator:
  extraEnvs:
    - name: STRIMZI_KAFKA_IMAGES
      # We use these images via our ECR Pull-through cache but you could also just reference them directly from Docker Hub and Quay like below
      value: |
        3.9.0=automqinc/automq:1.6.4-strimzi
        3.9.1=automqinc/automq:1.7.2-strimzi
        4.0.0=quay.io/strimzi/kafka:0.47.0-kafka-4.0.0
I highly recommend reading the following docs:
- This page explains most of the custom changes you need to apply when installing Strimzi together with AutoMQ.
- Deploying and Managing Strimzi Kafka clusters and honestly every page in this documentation will unravel the mystery more and more.
- Check out the Chart’s documentation on the exact tag that you use.
####
Update steps
If you ever want to upgrade the components, do it in the following order:
- Upgrade
strimzi-kafka-operatorchart to a version that matches at least the latest automq’s supported Kafka version: https://strimzi.io/downloads/ - Modify the
STRIMZI_KAFKA_IMAGESenv in the Helm chart to match the Kafka versions with the right AutoMQ version. - Upgrade Kafka cluster CRDs to match the latest supported Kafka version
STRIMZI_KAFKA_IMAGES
###
Creating a Kafka cluster
Now that you have the operator set up, it’s time to create a cluster. From this point onwards, you must master navigating your way through this documentation page. This page has more info than I could ever explain and it is absolutely necessary to check out all of the fields in every CRD you’re defining. Your set up needs would be different than ours, so it’s important that you’re aware of any options and configuration fields.
The following is the way I’ve set it up so far is as follows. You may choose a completely different path.
####
Kafka CR
A single Kafka instance per Kubernetes cluster. This will be the broker that handles everything we need.
- NodePools: We have NodePools: enabled. This is a great feature that simplifies configuring nodes separately while sharing some of the config. It also simplfies the
Kafkacluster instance. - Kraft: Absolutely enabled!
- Authorization: We rely on a ServiceMesh for our cross-pod traffic and mTLS, so for this set up we use
simpleauthorization with SASL Scram SHA-512 authentication. I’ll explain this further in theKafkaUsersection. When exposing multiple listeners, you have to understand that once the cluster is using simple authorization, you can’t use use internal port 9092 and expect to be able to connect to the brokers without authenticating yourself and being authorized to execute certain actions. - ServiceAccount and IAM Role: You need to create an AWS IAM Role and make sure that the role’s trust policy allows connections from the service account. [Read more]. The role must have a policy that allows the following actions from the AutoMQ pod on the Buckets that AutoMQ uses (The ones you hopefully created by now when following this guide):
s3:PutObjects3:GetObjects3:AbortMultipartUploads3:DeleteObjects3:ListBucket
####
KafkaNodePool CRs
For production, you should definitely separate your broker node pools from your controller node pools. We use 20GB of gp3 EBS volumes per broker node. When selecting resources for your nodes I would recomment starting at around cpu: 1000m, memory: 4Gi (both request and limit) for broker pods and cpu: 500m, memory: 2Gi for controller pods with a KAFKA_HEAP_OPTS value that leaves some breathing space available for those pods. Later on you can monitor and modify your values as needed but start small as possible. Kafka is able to process millions of messages per second on reasonably small instances if configured properly.
####
KafkaUser and KafkaAccess Operator
Once you enable authoriation you will need to start using KafkaUser resources to define how your user will be able to authenticate themselves and what are they authorized to do in the cluster. This is a great feature and works nicely. It creates a secret for the user and you can just inject that secret to the application pods that need to use it. However, it is common practice to put your Kafka Broker pods in a dedicated namespace and have your applications defined in a separate namespace. That’s where you start needing the Kafka Access Operator. It does a simple job, you define a KafkaAccess resource for a given KafkaUser and give it a namespace and it will take the secret from your broker namespace and put it in the target namespace.
AutoMQ’s Autobalancer: When you have Authorization set up for the cluster, you must make sure that AutoMQ’s autobalancer either has a user assigned to it on both your broker and controller nodes (recommended), or is a superuser. To tell autobalancer to use a specific user, set the following in your kafka config:
autobalancer.client.listener.name: SASLSCRAM-9094
autobalancer.client.auth.security.protocol: SASL_PLAINTEXT
autobalancer.client.auth.sasl.mechanism: SCRAM-SHA-512
autobalancer.client.auth.sasl.jaas.config: "${strimzienv:AUTOBALANCER_JAAS_CONFIG}"
And then pass the AUTOBALANCER_JAAS_CONFIG in your KafkaNodePool:
spec:
  template:
    kafkaContainer:
      env:
        - name: AUTOBALANCER_JAAS_CONFIG
          valueFrom:
            secretKeyRef:
              name: {{ .Release.Name }}-user-autobalancer
              key: sasl.jaas.config
              optional: true
Note: strimzienv must be named like this. It is an alias defined for org.apache.kafka.common.config.provider.EnvVarConfigProvider
###
KafkaTopic CRs
Now we have our brokers and controllers clustered together and we have a user that can do great things! Time to create a topic.
Creating a topic is done using a KafkaTopic resource. As usual, I recommend reading the official documentation for the details. There aren’t many gotchas if you know how Topics work in Kafka.
####
How many partitions do you need?
This is another topic you absolutely don’t want to take lightly. Unfortunately explaining this would take another book and is out of the scope of this article. The video on this page explains the basics nicely but when you get your hands on it and start consuming events it becomes quite important that you set your partition size correctly.
If you’re already overwhelmed with all of the info so far and just want to get something up and running for testing I recommend the following approach:
- If you don’t care about the ordering of events and your consumers should be able to just process without coordination on the order, it is safer to over-provision than to under-provision. The number of your consumers must be lower than or equal to your partitions. In other terms, a consumer may be assigned to multiple partitions but a single partition may only be consumed by one consumer at a time. For example:
- If you have 10 partitions and 100 consumers, only 10 consumers are active and the other 90 are sitting idle.
- If you have 100 partitions and 10 consumers, all 10 consumers are active and they can consume from all of the 100 partitions in parallel.
- If you care about the ordering and your usecase is simple and one consumer could do, just use a single partition.
The moment you decide this is something you want to put in production, it is absolutely necessary that you understand how you should partition your topics based on factors such as, scale of stored data, if parallelism is needed or even possible, or if global order of events matter.
####
How do I partition
With similar importance to the previous section, once you decide to have more than a single partition, you should partition your events in such a way that your messages are spread equally on all partitions. That means choosing the right “key” for your data so that no partition gets assigned a disproportionately large number of messages. Such partition would be called a “Hot Partition”, but not “Hot” as in “Sexy”.
If you’re designing the platform but not the applications like me, you need to explain this to your developers. I’ve decided to design the Gateway component in such a way that will allow 3 types of event production:
- Producer let’s the Gateway component decide on a partition key based on the message contents. This is low effort way and works for majority of small scale cases.
- Producer passes a partition key and let’s the Gateway (well, the producer Kafka client inside the Gateway) do the hashing and partition number assignment. This is a better choice for when the producer knows a good partition key candidate such as the
user_idorproduct_id. - Producer does the partitioning on their side and passes an explicit partition number. This one can be trickier than the other solutions as when you increase your partition size, you would need to update the producers to produce to the new partitions as well.
####
Name your topics with an evolution plan in mind
This article could teach you some good practices. But the important part is that you come up with a sturdy naming pattern at the beginning and not delay the decision to later. It will be much harder later to change things once they’re stablished. Sooner or later you will need to migrate or duplicate or evolve your topic and at that point you would thank your past self that you had versioned your topic name.
####
Topic Retention
Do not just store data forever. If you do not set a default retention date. S3 might be cheap but it’s certainly not free and apart from that, you shouldn’t create wasteful systems! Talk to your developers and figure out what the data retention must be per topic. If you give people the option, they would always choose a super long retention time so that they don’t ever have to face problems. 9 out of 10 times, they will never use that old data. Even if you do allow longer than needed retention time, try to change the culture around you in such a way that people actively consider this types of improvements.
##
ClickHouseDB Set up
We can now start ingesting the data that is produced to a Kafka topic.
Regarding the clickhouse-operator setup, the only note I could add is that you might be at first confused to see that there are 2 active clickhouse-operator projects out there:
- The new official one from ClickHouse: -> This is the one we’re using
- The one from Altinity
Other than that a standard set up would do
###
KeeperCluster and ClickHouseCluster CRs
Once the operator is in place you can start creating your HA ClickHouse cluster instances. Their official documentation along with their examples folder are great places to start.
The following sections explain the configurations that I found a bit interesting.
####
Start with very small database instances and let them break
The default configuration of the database instances has some quirks which you may miss at the start. If you’re new to Clickhouse and self-hosting a distributed database, I suggest you start with very small instances and put them under heavy load until they break. Only then try to figure out how to tweak it for your specific goals and learn along the way. If you start directly under full load in production without optimizing first, you will get absolutely bashed.
####
Some System Tables grow indefinitely if you don’t configure their Partitioning and TTL strategies
Examples are the part_log, query_log, text_log, metric_log, and the asynchronous_metric_log tables. Gladly you can configure them to clean up after a certain amount of time by setting a partition_by and ttl just like you would with any other ClickHouse Tables. To give you an example, you could do:
apiVersion: clickhouse.com/v1alpha1
kind: ClickHouseCluster
metadata:
  # ...
spec:
  settings:
    extraConfig:
      metric_log:
        # This interesting syntax took me a while to figure out, so I'm very proud to present it here today!
        # See https://clickhouse.com/docs/concepts/features/configuration/server-config/configuration-files#example-1 for more examples
        "@remove": 1
      query_log:
        database: system
        partition_by: toYYYYMM(event_date)
        table: query_log
        ttl: event_date + INTERVAL 14 DAY DELETE
      # Repeat the same for the rest depending on your needs
####
Named Collections are great
Named collections provide a way to store collections of key-value pairs to be used to configure integrations with external sources. You can use named collections with dictionaries, tables, table functions, and object storage. Source: Named collections
What this means for you is that instead of hardcoding your Kafka username and password in your Kafka Table Engine (which I’ll show you later), you can inject them as env var in your ClickHouseDB pods as secrets like so:
apiVersion: clickhouse.com/v1alpha1
kind: ClickHouseCluster
metadata:
  # ...
spec:
  containerTemplate:
    env:
      - name: CLICKHOUSE_MY_APP_USER_PASSWORD
        valueFrom:
          secretKeyRef:
            key: password
            name: my-app-user-password
      - name: KAFKA_SASL_MECHANISM
        valueFrom:
          secretKeyRef:
            key: saslMechanism
            name: kafka-user-my-events-db # Assuming you've already created this and the other secrets the way you're used to create your secrets
      - name: KAFKA_SASL_USERNAME
        valueFrom:
          secretKeyRef:
            key: username
            name: kafka-user-my-events-db
      - name: KAFKA_SASL_PASSWORD
        valueFrom:
          secretKeyRef:
            key: password
            name: kafka-user-my-events-db
  settings:
    extraConfig:
      named_collections:
        kafka_connection:
          kafka_broker_list: <placeholder-your-kafka-endpoint>:<your-kafka-port>
          kafka_sasl_mechanism:
            - '@from_env': KAFKA_SASL_MECHANISM
          kafka_sasl_password:
            - '@from_env': KAFKA_SASL_PASSWORD
          kafka_sasl_username:
            - '@from_env': KAFKA_SASL_USERNAME
          kafka_security_protocol: sasl_plaintext
Then where you create your Kafka Table engine, you could use the configuration just by referencing the named collection like this:
CREATE TABLE IF NOT EXISTS my_kafka_events_queue (
    -- your fields here
) ENGINE = Kafka(kafka_connection) SETTINGS
  -- The rest of your settings go here, for example
  kafka_group_name = 'clickhouse_analytics_group',
####
Creating users using extraUsersConfig setting
extraUsersConfig setting
You can create new users in your ClickHouseCluster like so:
apiVersion: clickhouse.com/v1alpha1
kind: ClickHouseCluster
metadata:
  # ...
spec:
  containerTemplate:
    env:
      - name: CLICKHOUSE_MY_APP_USER_PASSWORD
        valueFrom:
          secretKeyRef:
            key: password
            name: my-app-user-password # Assuming you've already created this secret somehow
  settings:
    extraUsersConfig:
      users:
        my-user:
          grants:
            - query: GRANT ALL ON *.* # Reduce this to what your user needs
          password:
            - '@from_env': CLICKHOUSE_MY_APP_USER_PASSWORD
          profile: default # You can customize this: https://clickhouse.com/docs/concepts/features/configuration/settings/settings-profiles
          quota: default # See: https://clickhouse.com/docs/concepts/features/configuration/settings/settings-users#user-namequota
####
A dangerous backdoor by default: The default user is created without a password
default user is created without a password
If you don’t set the spec.settings.defaultUserPassword, a user with username default will be created with no password set. This will be a clear backdoor, of course. So make sure to set it on your ClickHouseCluster CRs.
###
Creating ClickHouseDB Tables
At this stage, the first thing you need to do is to quickly glance through this and related pages in the official ClickHouseDB documentation.
Once you have sort of an idea how this will be set up, go to that link I mentioned earlier on incremental materialized views, watch the video, then navigate to the page that explains the concepts in more depth. Once you’re done there, go back to the Kafka Table Engine page and try to set up a table.
Let’s begin together with a simple example. Given your event’s protobuf schema looks like this:
syntax = "proto3";

package my_analytics.v1;

option java_multiple_files = true;
option java_package = "com.example.team.telemetry.schemas.myanalytics.v1";

enum Platform {
  PLATFORM_UNSPECIFIED = 0;
  PLATFORM_ANDROID = 1;
  PLATFORM_IOS = 2;
  PLATFORM_WEB = 3;
}

message MyAnalyticsEvent {
  string device_id = 1;
  string video_id = 2;
  Platform platform = 3;
}
Note: For the sake of simplicity, we will assume that all of these fields will be set and won’t be null (even though they could be seen as null with Protobuf v3 spec)
Your first table’s will look something like this:
CREATE TABLE IF NOT EXISTS raw_events_queue (
    device_id String,
    video_id String,
    platform Enum8(
        'PLATFORM_UNSPECIFIED' = 0,
        'PLATFORM_ANDROID' = 1,
        'PLATFORM_IOS' = 2,
        'PLATFORM_WEB' = 3
    ),
    -- Maybe some more fields
) ENGINE = Kafka(kafka_connection) SETTINGS
    format_schema_source = 'string',
    format_schema = 'syntax = "proto3"; package my_analytics.v1; option java_multiple_files = true; option java_package = "com.example.team.telemetry.schemas.myanalytics.v1"; enum Platform { PLATFORM_UNSPECIFIED = 0; PLATFORM_ANDROID = 1; PLATFORM_IOS = 2; PLATFORM_WEB = 3; } message MyAnalyticsEvent { optional string device_id = 1; optional string video_id = 2; optional Platform platform = 3; }',
    format_schema_message_name = 'MyAnalyticsEvent',
    kafka_topic_list = '<comma-separated-list-of-your-kafka-topics>',
    kafka_format = 'ProtobufSingle',
    kafka_group_name = 'my_analytics_clickhouse',
    -- Some other settings that I'll explain in a bit
    ;
This raw_events_queue table will act as a stream of events. It will not actually store any of the incoming messages. To actually use the events from this stream we need to somehow write them to a table. Now is the time that all of that Materialized View knowledge comes in handy.
Fun fact: This raw_events_queue will not start consuming data from the topic yet. It will only do so once the first Materialized View starts reading from it.
Now let’s design a simple aggregation just for the sake of learning the flow. It will not have any real use at this point.
-- First we create the Target Table
CREATE TABLE IF NOT EXISTS video_play_stats (
    video_id String,
    platform Enum8(
        'PLATFORM_UNSPECIFIED' = 0,
        'PLATFORM_ANDROID' = 1,
        'PLATFORM_IOS' = 2,
        'PLATFORM_WEB' = 3
    ),
    total_plays UInt64
) ENGINE = SummingMergeTree(total_plays)
ORDER BY (video_id, platform);

-- Then create the Materialized View
CREATE MATERIALIZED VIEW IF NOT EXISTS video_play_stats_mv
TO video_play_stats AS
SELECT
    video_id,
    platform,
    toUInt64(1) AS total_plays
FROM raw_events_queue;
Note: In ClickHouse, you may not always see the aggregated results immediately, that is simply due to how ClickHouse is designed. At first you might find it a bit odd but you will at some point start to appreciate it. If you are just testing and want to have the aggregation finalized immediately, you could force it using the OPTIMIZE TABLE <table-name> FINAL; comand. Just don’t use it obsessively.
The flow of data will be as follows:
- When the
video_play_stats_mvMaterialized View is added, it triggers theraw_events_queueto start consuming events from the topics you specified withkafka_topic_list. - As the events arrive, the
raw_events_queuetable parses them given the Protobuf defition andvideo_play_stats_mvreads the fields exposed byraw_events_queue. - The
video_play_stats_mvwill then write those tovideo_play_stats(note theTO video_play_statssyntax) - The
video_play_statstable uses aSummingMergeTreewhich as the name suggests will sum the records based on grouping rules. In this example, theORDER BY (video_id, platform)is what does the grouping. Clickhouse then sumstotal_playsas explicitly defined in theSummingMergeTree(total_plays)syntax.
I think this example should be a good one to help you understand the basic flow (but going deeper on the specifics of ClickHouseDB Table Engines is again beyond the scope of this article).
####
Parallel consumers
By setting kafka_num_consumers and kafka_thread_per_consumer fields you can specify how many consumers will be consuming data in parallel from your Kafka topic. (See the partitioning section above for more info)
Example usage:
CREATE TABLE IF NOT EXISTS raw_events_queue (
) ENGINE = Kafka(kafka_connection) SETTINGS
    -- How many consumers will be consuming in parallel (per replica. So if you have 2 instances active, you will actually see 16 active consumers)
    kafka_num_consumers = 4,
    -- You could set this to 0 in your acceptance environment to reduce overhead and costs if your CPU count is less than your consumer count
    kafka_thread_per_consumer = 1,
    -- Other settings
####
Error handling with kafka_handle_error_mode
kafka_handle_error_mode
Clickhouse will by default crash on any Deserialization errors and you absolutely would want to avoid that. Gladly, that’s not that complicated (Although some versions such as v26.5 had a bug that would cause the DB to SegFault. This was fixed when I upgraded to v26.7 (not sure which specific patch version contained the fix.))
The kafka_handle_error_mode setting gives you two ways to handle errors:
stream: adds_errorand_raw_messagevirtual columns to your table. All the materialized views consuming from this table downstream MUST only read the recordsWHERE len(_error) = 0. If you just set this setting tostreamand forget to add theWHEREclause, you will still crash the db.dead_letter_queue: In this case the error data is stored insystem.dead_letter_queue. I wouldn’t recommend this approach because it’s a bit rigid.
My current prefered solution to have a DLQ or a way to see what went wrong is to use kafka_handle_error_mode: stream and create a table and a materialized view that only reads the errored records:
CREATE TABLE my_kafka_events_queue_errors (
    error_time DateTime DEFAULT now(),
    raw_message String,
    error_reason String
) ENGINE = MergeTree
ORDER BY error_time
TTL error_time + INTERVAL 7 DAY;

CREATE OR REPLACE MATERIALIZED VIEW my_kafka_events_queue_errors_mv
TO my_kafka_events_queue_errors
AS
SELECT
    now() AS error_time,
    _raw_message AS raw_message,
    _error AS error_reason
FROM my_kafka_events_queue
WHERE length(_error) > 0;
Kafka Table engine also gives you a kafka_skip_broken_messages which is quite a mystery for me so far. I can’t fully visualize how this works together with the kafka_handle_error_mode option. @clickhouse if you read this could you improve the doc on this field, please? Thanks in advance!
####
Using nested proto structures with oneof fields
oneof fields
As your event grows, you need to decide if you want to have a flat message structure or a nested one. Both options are valid depending on your context. In protobuf, if you choose to nest fields, you would use the oneof keyword. Let’s expand our example slighly:
-- Removed for simplicity
message MyAnalyticsEvent {
  -- Removed for simplicity
  optional Platform platform = 3;

  oneof event_payload {
    VideoStarted video_started = 4;
    VideoEnded video_ended = 5;
  }
}

message VideoStarted {
  uint64 time_to_first_frame_ms = 1;
}

/* This is a valid protobuf message which needs a workaround to use in ClickHouse which I will explain if you read a bit further */
message VideoEnded { }
Gladly Clickhouse supports this too by setting input_format_protobuf_oneof_presence = 1 on the table (where the rest of the settings are) but it does require some extra work and there are gotchas. Please refer to this page for more info.
For this example we would need to modify our table like so:
CREATE TABLE IF NOT EXISTS raw_events_queue (
    -- Other fields are irrelevant for this example
    event_payload Enum8(
        'none' = 0,
        'video_started' = 4,
        'video_ended' = 5,
    ),
    video_started_time_to_first_frame_ms Nullable(UInt64),
    video_ended_dummy Nullable(Bool)
) ENGINE = Kafka(kafka_connection) SETTINGS
    -- We've changed below setting
    format_schema = 'syntax = "proto3"; package my_analytics.v1; option java_multiple_files = true; option java_package = "com.example.team.telemetry.schemas.myanalytics.v1"; enum Platform { PLATFORM_UNSPECIFIED = 0; PLATFORM_ANDROID = 1; PLATFORM_IOS = 2; PLATFORM_WEB = 3; } message MyAnalyticsEvent { optional string device_id = 1; optional string video_id = 2; optional Platform platform = 3; oneof event_payload { VideoStarted video_started = 4; VideoEnded video_ended = 5; } } message VideoStarted { uint64 time_to_first_frame_ms = 1; } message VideoEnded { bool dummy = 1; }',
    -- We've added below setting
    input_format_protobuf_oneof_presence = 1,
    -- Other settings are irrelevant for this example
    ;
I would like to take your attention specifically to the end of the value of the format_schema setting: message VideoEnded { bool dummy = 1; }. This is a way to get around a ClickHouse limitation. ClickHouse’s input_format_protobuf_oneof_presence cannot detect empty protobuf messages. This affects VideoEnded and any other events that don’t have any nested fields. We have a dummy field in such events to work around this. This field does not need to be set by our event producers. You can also not even add this dummy field in your main schema to keep it clean and only add it to the schema that ClickHouse uses. Your clients then won’t need to see an ugly dummy field in your generated sdks.
This is quite an annoying issue because nesting with protobuf is quite nice for the readability of the generated code and reduces possible human “forgetting” errors. Hopefully ClickHouse addresses this at somepoint (Thanks in advance!)
####
Other Kafka Engine tweaks
From this point onwards, you can tweak kafka_max_block_size, kafka_flush_interval_ms, kafka_poll_timeout_ms values to something that matches your rate of event production and the latency your db record consumers expect.
###
Maintaining High-Availability with Replicated* tables
Replicated* tables
If High-Availability is a requirement of your system, you need to replicate your data so that in case of node failures or one pod being restarted, you will still be able to query your data. If you’re new to the ClickHouseDB and clickhouse-operator user manual like me, you might think that if you tell the operator to create a ClickHouseCluster with replicas: 2 and shards: 1 you will have one primary and one replicated DB instance and that if you create a MergeTree (or any other basic) table and start inserting data into it, that data would be replicated to the other instances.
ClickHouse is of course more sophisticated than that. Instead of having replication on the entire database, ClickHouseDB allows you to make a decision about that on the table level. This can be achieved very easily if you use the operator by prefixing your table name with Replicated. Note that at the time of writing this article this is only possible for the merge-tree family of tables. Read more about Replicated Tables.
###
Scaling ClickHouse replicas
In ClickHouseDB you can’t just alter a table’s engine but there are several ways to create a new table and move the data from an older table. So it’s important to consider early on if you need any Replicated* table engines or not if your design needs are complex.
Scaling up: When using clickhouse-operator, if you have a table backed by a Replicated* engine (e.g. ReplicatedSummingMergeTree), you can easily scale up by increasing the number of replicas (assuming that you have a KeeperCluster CR already available).
Scaling down: Scaling down is similarly very easy but there’s a very important catch. To drop a replica, first reduce the replicas in your ClickHouseCluster. Then you need to tell the Keeper to remove the old replica. If you don’t do this, the cluster assumes that the old replica is offline and the replication queue keeps growing until you run out of disk. You can drop the old replica using the SYSTEM DROP REPLICA '<replica> command.
###
Sharding and Distributed tables
Distributed tables
I would like to start this section by saying: You probably don’t need sharding. You may, however, need to clean up and reduce your data. Horizontal scaling is great but so is vertical scaling. Only start scaling horizontally once your system is maxed out on vertical gains.
But sure, if you really want to scatter your data around, you can easily start sharding your data. Clickhouse and the operator make that pretty simple with the shards option in ClickHouseCluster CRD. When you want to shard but are too lazy to do the sharding orchestration yourself, a Distributed table could come in very handy. When INSERTing records into the database, you could insert directly to a Distributed table takes a sharding key and routes it to one of the nodes based on that. Similarly with read queries, the Distributed table queries the relevant instances for the query to fetch the data (scatter-gather).
###
Data retention using TTLs
TTLs
This is very simple to achieve using their TTL syntax. ClickHouseDB let’s you define TTL per row or per entire table. Similar to other database solutions, if you already have your data partitioned, the data deletion is much more efficient. [Read more].
###
Enriching your data using Dictionaries
ClickHouseDB’s Dictionaries, let you query data from an internal or external source (such as your main application’s DB). Here’s an example Dictionary that fetches data from a Postgres database.
CREATE DICTIONARY IF NOT EXISTS my_enrichment_data (
        video_id String,
        video_title String,
        duration_ms UInt64,
        thumbnail_url Nullable(String)
    )
    PRIMARY KEY video_id
    SOURCE(POSTGRESQL(
        host '<your-postgres-host>'
        port 5432
        user '<your-postgres-user>'
        password '<your-postgres-password>'
        db '<your-postgres-database-name>'
        update_field 'updated_at'
        update_lag 60
        table 'my_videos'
        sslmode 'require'
    ))
    LIFETIME(MIN 300 MAX 600)
    LAYOUT(HASHED())
Now we can use this table like any other table, with even some additional tools and dictionary specific functions to enrich our data during either query time or insert time. [Read more]
Note: When using Dictionaries to pull data from your other databases it is important that you first understand that this could possibly put a lot of load on your other databases if it is not configured correctly. In our example we fetch all of the data once, so there will be a one time massive query, but after that ClickHouseDB uses the update_field 'updated_at' setting to only fetch the data that was updated since our last query [Read more]. LIFETIME(MIN 300 MAX 600) tells the database how often we want to sync this table. The reason why we need a range is explain nicely in their official documentation.
##
NetworkPolicies
Slightly unrelated to the core of this article but I suggest you use Kubernetes NetworkPolicies on top of mTLS and the Authentication methods that Clickhouse and Kafka provide.
You will have certain active routes for example from your backend application to Clickhouse and from Clickhouse to Kafka brokers. This not only adds to your security, but also makes sure that applications get an explicit permission to talk to certain pods. This will help you understand your producer and consumer relations better and make migrations a lot less of a guess-work.
##
Separate your Event Ingestion Proxy from your applications
Initially we had an architecture in place that had a single Network Load Balancer that would route all the application traffic and the event traffic to our Kong instances that were initially handling all “normal” application traffic. The issue with that was that the Event’s come in at a very high rate and it’s not always easy to reason about their pattern. They may or may not correlate 1-on-1 to your application traffic. So scaling the ingress gateway becomes very tricky. At worst case scenario [true story] your event traffic will break the ingress, causing downtime on the vital applications.
To save yourself from panic and post-mortems, I suggest you make sure that your event traffic is completely isolated from your other (vital) application traffic.
Other than separating our Event traffic from our Application traffic (not sure what else to call it). We chose to go one step further and isolate our events traffic into:
- One route for high-throughput analytical events
- One route for low-throughput vital events. This one has higher security and rate limitting in place.
#
Testing it
That was it! If you’ve followed this and made stuff, you now have a fully fledged Event Streaming & Analytics platform!
At this point you just need to start producing events and see how your system performs. I would first start checking if the data gets into Kafka and once that’s there you can track the client lag for your ClickHouse consumers and check the ClickHouseDB logs and tables to see how the system is performing.
##
Dashboards and observability
Each of components we used exposes lots of metrics which you can listen to and create as many alerts and dashboards as you want. If you also make your custom gateway, make sure to expose some metrics you can visualize. Otherwise you’ll be walking around blindly.
For Kafka, I’ve set up an instance of Kafbat-UI (formerly Kafka-UI) and it does a great job so far. I’m happy.
For ClickHouseDB I use CH-UI and I really like the built-in dashboard it offers.
Strimzi has a bunch of dashboards you could use, so does AutoMQ. I suggest grabbing an existing one and tweaking them to your needs.
#
How it is going: Spoilers
##
Strimzi
I had my doubts regarding Strimzi before I started using it because setting up a Kafka cluster with Strimzi also has a lot of edge cases and complexities, but it was definitely worth the learning journey and once it is set up, it “just works”.
##
AutoMQ
AutoMQ is really great! For our usage it delivers great and the cost matches exactly what we expected.
The downsides are:
- Documentation is in some cases scattered or hard to find (but it’s there somewhere)
- As the time of writing [July 2026], AutoMQ still doesn’t support Kafka v4+ while that version is already out for quite some time already.
##
Cost-optimization vs Total Cost of Ownership
In the Choices section above I’ve explained that one big reason I’ve chosen this solution was because it was low on Cloud costs, however we always have to consider the total cost of building and maintaining such solution. In practice we’re not spending that much time on the platform after the initial implementation. Sure, it took me a couple of weeks (8 maybe) to do the initial platform set up and the Strimzi and ClickHouse cluster needed some occasional fixes and tuning at the start when the platform was young but they are truely low cost in the sense that they don’t need to be actively modified. The company now pays less for maintaining this solution and has aquired more knowledge along the way. I truely believe this is how we should deal with things. Take on big challenges and learn. Be ready to fail. Sure buying is easy and you don’t have to wake up at night, but then you could also invest in your peoepl so they become better at building solution that doesn’t need them to wake up at night. But that’s for another article!
The part regarding educating the developers on how to use these tools could be seen as a slightly different story. We’re unfortunately in a bullshit generating AI era and cannot force people to rely on their own learnings and capacity. We can encourage, but not gatekeep. It probably takes more energy and effort to deal and try to educate the slop generating developers than to set up this whole platform. This is unfortunately the new reality and is not limited to this project but is an ongoing issue on all fronts. Even if that was not an issue, any other solution we would’ve chosen, we needed to put a similar amount of effort, teaching our developers. Arguably much more effort if we would’ve chosen Apache Flink instead of ClickHouseDB for example.
In terms of cloud cost, in practice it costs us around $750/month (before AWS discounts) to run the event streaming + analytics database stack, including Strimzi nodes, S3 buckets, Network traffic, Clickhouse nodes, EBS volumes etc. This will not increase much because the Strimzi cluster will be able to handle much more than our current needs without any upscaling. New applications will need dedicated Clickhouse instances. I count that as the cost of the application and not that of the platform.
##
Creating a new project
Going back to:
It must be easy to use
Other than the system being simple to learn and understand for our devs, it must be very easy to start a new project and provision all the necessary resources. In our current flow takes only 5 minutes and a few yaml modifications to provision resources for a fresh new project. All we need to do is:
- Insert a new item in the Helm Chart where we have the list of our Kafka topics and configure it specifically for that project
- In the same list modify ACLs to allow only the right applications to be able to access that topic
- Insert a new item in the Helm Chart where we have the list of our ClickHouseDb instances and configure those
- All secrets are automatically created based on values stored in our secret manager and are injected in the namespaces where they will be used
#
What can be improved
Of course this is not the end yet. We’ll make many mistakes and maybe some good decisions along the way and learn. I’ll try to come back to this article and update the learning as we go.
##
Knowing cost of operation per tenant/topic
Since we have got everything on the same Kafka cluster, we could just look at the size of each topic’s messages and deduce something from it but it would be nicer to have a better mechanism to extract the total cost of operation per tenant. Something to consider soon.
##
I would like a way to get more visibility into Events for debugging purposes
As events start flowing in at a rate of thousands per second, it becomes harder to find and debug a specific subset of events based on certain characteristics. You could tap into a topic with a new consumer with a simple script and do that but it would be nicer to have a unified simple way to achieve this at scale.
#
Final words
Thanks if you read so far! I really enjoyed learning about the subjects I’ve discussed in this article and I hope this was interesting to you as well. If you’re new to all of this, don’t panic. This is a lot to take in and takes some time and effort to even start getting a basic understanding and you will make mistakes along the way from which you will learn. In my journey, after first getting some hands-on experience, the DDIA Book really helped understanding the theoretical parts about every way you could design a system rather than just copy pasting config.
Please feel free to reach out if you have any suggestions! I would love to hear some feedback or tips as I’m sure there are lots to improve. Cheers!
I will update this article based on the feedback and once I learn new things.